RADOR: Rapid Actionable Data for Opioid Response in KY
Opioid use disorder (OUD) remains a persistent public health crisis and epidemic. Kentucky had the fifth-largest drug overdose fatality rate in the United States in 2023, with around 79% of those deaths involving opioid substances. Frequently, efforts to reduce opioid overdoses and support opioid overdose control and prevention are limited by delays in data availability, fragmented data systems, and differences between community-level needs. In the context of the dynamically changing opioid epidemic, agencies and organizations responsible for monitoring and improving the health of the population need timely (state and local) data to make critical decisions on resource allocation and targeted responses.
The Rapid Actionable Data for Opioid Response in Kentucky (RADOR-KY) team at the University of Kentucky is working to address these problems. This team is building a statewide surveillance system, utilizing timely data from a variety of sources around Kentucky, to monitor and respond to the opioid crisis. At the CAAI, we work with this team to provide research support through machine learning and forecasting methods. A key aspect of the RADOR-KY project is to produce timely, relevant, and accurate forecasts of suspected opioid overdose incidents around Kentucky. By aggregating Emergency Medical Services (EMS) response data at different geographical levels, we can determine where overdose events are expected to increase or decrease in the coming months. With this information, adequate support could be prepared and provided to those areas with the hope to treat victims in time and reduce the number of deaths associated with opioid-related incidents. We make these forecasts available to view through public dashboards here.

Time series forecasting is the process of using machine learning or statistical methods to analyze the trends and patterns of time-dependent data and create future predictions of that data. Past values of the target series are typically used to understand the trends and forecast them into the future, but additional data sources can also be used to aid in the predictions. We have worked with a variety of different data sources from the RADOR-KY project, many of which are helpful to use as covariates, or additional variables, with forecasting models. These additional data sources include:
- Social determinants of health for each county, such as unemployment rate, vehicle access, and age distributions
- Aggregated Medicaid claims containing counts of individuals receiving medication for OUD or behavioral health treatment
- Kentucky State Police drug seizures for opioid substances
- Kentucky Department of Corrections substance use risk measures for supervision intakes and releases
- Urine drug testing positivity rates collected at substance use disorder treatment clinics, gathered by Millennium Health
We have also experimented with different machine learning models to perform forecasting, such as linear regression, the N-Linear model, and the Temporal Fusion Transformer (TFT). These models vary in their generalizability and complexity, but all are capable of utilizing the different covariates and creating forecasts on a variety of different series at the same time. This is important because we group the EMS data based on different geographical regions. Initially we focused on the county level, but due to data sparsity in less populated areas, larger Area Development District (ADD) regions have also been used.
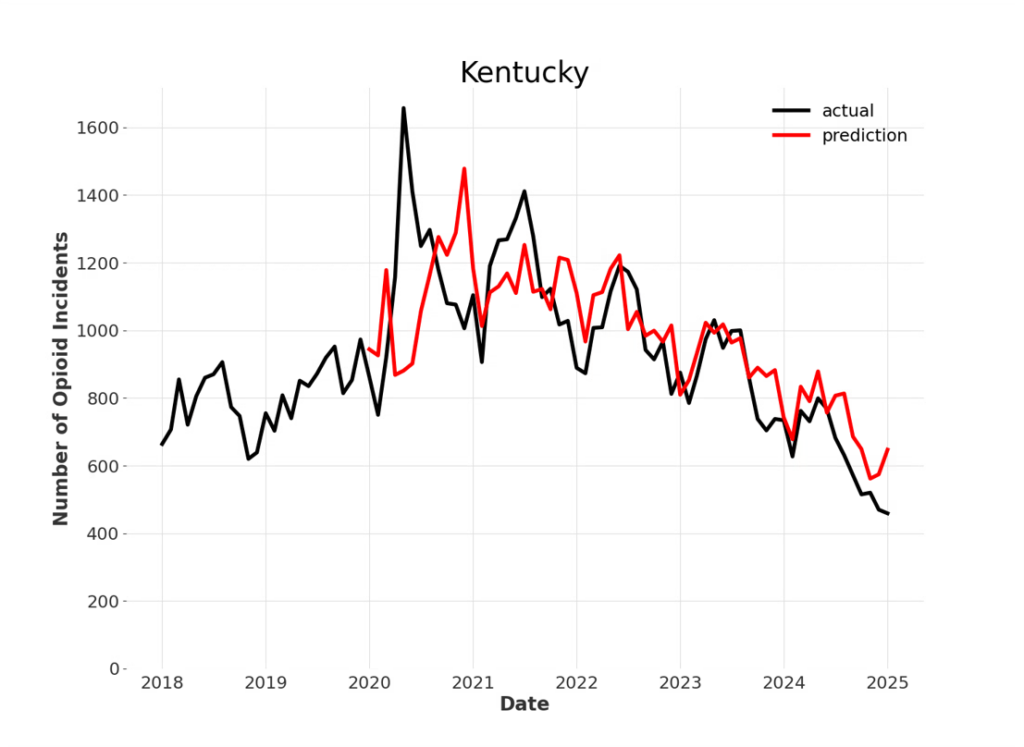
By using these covariates, we can produce accurate forecasts at many geographical levels, including county, ADD, and state. Below, an example is given of the statewide suspected opioid overdose trend, along with predictions generated through expanding window training. In this process, the model is only trained on two years of data at the beginning, then makes three-month predictions before incorporating real data for those three months and learning from its error. At the end, the model learns the trends and relationships with covariates very well and is able to produce accurate modern predictions.

We will continue to test new models and external data sources to improve forecasting accuracy. Still, the current results show that forecasting opioid overdoses around Kentucky is possible with limited error and will prove useful to state agencies for determining when and where opioid overdoses can be expected to increase or decrease.
You can learn more about the RADOR project here.

