
Clinicians often produce large amounts of data, from patient metrics to drug component analysis. Classical statistical analysis can provide a peek into data interactions, but in many cases, machine learning can provide additional insight into new features. Recently, with the boom of new artificial intelligence models, these clinicians are more interested in applying machine learning to their data. However, in many cases, they may not possess the necessary knowledge and skills to effectively train and infer a model. Fortunately, using ML techniques and a user-friendly web interface, we can provide these clinicians with a way to automatically train tabular data on many different machine learning models to find which produces the best results. Therefore, we present CLASSify as a way for clinicians to bridge the gap to artificial intelligence.
Even with a web interface and clear results and visualizations for each model, it can be difficult to interpret how a model achieved its results or what it could mean for the data itself. Therefore, this interface can also provide explainability scores for each feature that indicates its contribution to the model’s predictions. With this, users can see exactly how each column of the data affects the model and could gain new insights into the data itself.
Finally, CLASSify also provides tools for synthetic data generation. Clinical datasets frequently have imbalanced class labels or protected information that necessitates the use of synthetically-generated data that follows the same patterns and trends as real data. With this interface, users can generate entirely new datasets, bolster existing data with synthetic examples to balance class labels, or fill missing values with appropriate data.
Below is a step-by-step walkthrough of using the interface. If you prefer a video, there is a tutorial video at the bottom of this page.
Workflow:
First, the user will upload their tabular dataset, which must take the form of a csv. The only requirement of the csv is that the class column has the name ‘class’. Many variable types are accepted, including integers, floats, booleans, and strings.

Once the dataset is uploaded, a modal will appear that contains a row for each feature in the dataset. The datatype of each feature will be automatically inferred, but users can change any of the datatypes here. This may be necessary if, for example, a categorical variable is encoded with integers in the dataset. This would be automatically interpreted as an integer variable, so the user may want to change that here. When features are considered categorical, they are automatically one-hot encoded by the system.

After the data is uploaded, it is sent to ClearML, the platform used for hosting datasets and models.
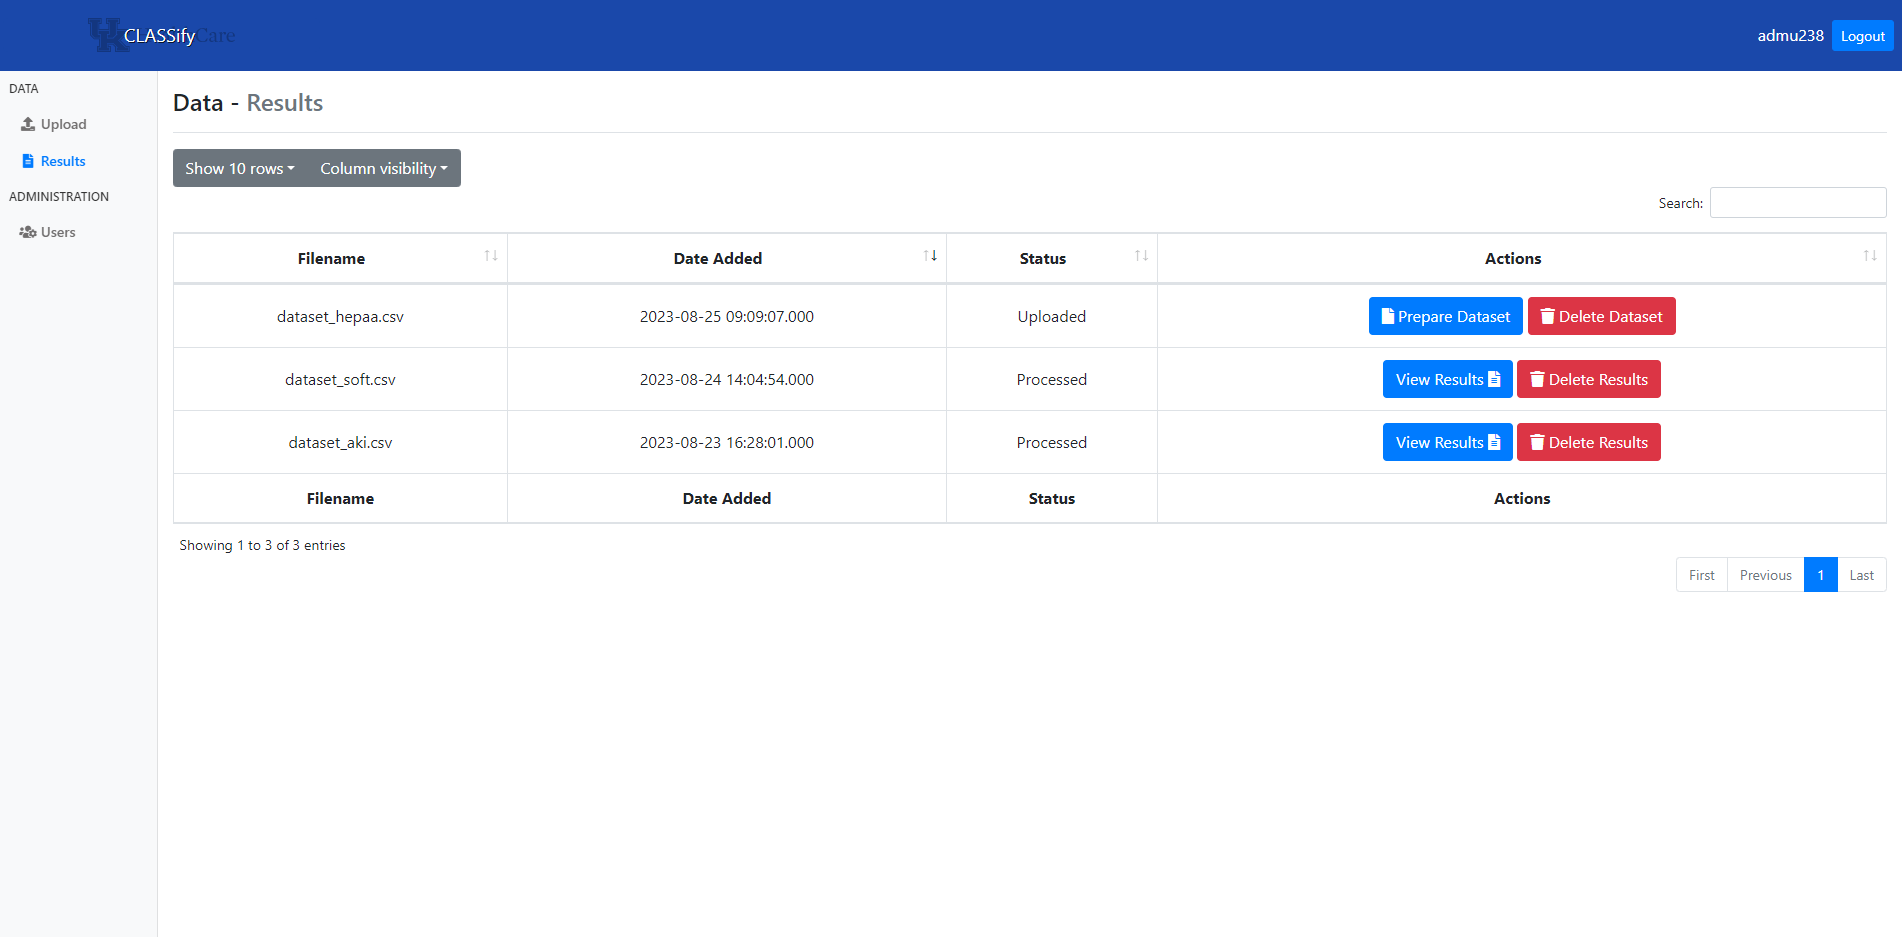
On the home page, users can view all datasets they have uploaded and any previously generated results. Here, the ‘Prepare Dataset’ is the next step to performing training on a new dataset.
The preparation page gives many options for parameter values and customizations to the training process. Some of the important ones to consider include the choice of which models to train, whether the dataset is binary or multiclass, whether to perform testing on a separate dataset, and whether to generate synthetic data. Additionally, users can choose to produce visualizations and SHAP scores here. Users can also modify any of the parameters used in the models. It is recommended that users who are inexperienced with machine learning leave the parameter default values; however, experienced users can modify any of these parameter values to fit their specific needs. Once the options are chosen, training can begin on an agent that is running through ClearML. Distributed training has been implemented, allowing for multiple different machines to perform training at once. Once all of the models have finished training, the results and any generated artifacts are uploaded to ClearML, and then downloaded to the site.

On the results page, users can view various performance metrics for each model or feature combination, depending on the parameters chosen. Users can also view the explainability scores for each feature. On this page, users can download models or any synthetic data, view visualizations, or view output logs of the training process. Also, users can upload a new test set at any time, and the models will be evaluated again.

Below is one example of the type of visualization that will be generated, which displays the performance of each model in various metrics. This can be used to compare the models and determine which is the appropriate choice, depending on what metrics are most important to the user’s goals.

These visualizations may also include graphs that display the SHAP explainability scores for different features. In the example below, which uses data on breast cancer from a public dataset, the top feature, ‘perimeter_worst’, was determined as the most important feature to the model. By observing the color and position of those data points, the user can interpret that lower feature values have a negative impact on the model’s predictions (influence the model to predict closer to 0 instead of 1, for binary classification), while higher feature values have a strong positive impact (influence the model to predict closer to 1 instead of 0). Therefore, high values of this feature are associated with positive predictions, while low values are associated with negative predictions.

A paper detailing the development and usage of this tool was submitted and accepted to the American Medical Informatics Association (AMIA) in 2023. This paper can be found here: https://arxiv.org/abs/2310.03618
Instructional Video:
Below is a ~10 minute tutorial video walking through the process of using CLASSify. If you would like access to this tool, reach out to Aaron.Mullen@uky.edu.