In 2020, Kentucky had the third-largest drug overdose fatality rate in the United States, and 81% of those deaths involved opioids. The purpose of this project is to provide research support to combat the opioid epidemic through machine learning and forecasting. The goal is to provide accurate forecasts based on different geographical levels to identify which areas of the state are likely to be the most “high risk” in future weeks or months. With this information, adequate support could be prepared and provided to those areas with the hope to treat victims in time and reduce the number of deaths associated with opioid-related incidents.
The first step was to analyze what geographical level would be most appropriate for building and training a forecasting model. We had EMS data containing counts of opioid-related incidents based on six different geographical levels: state, county, zip code, tract, blockgroup, and block. Through experimentation, it was found that the county level is likely the most appropriate scale. State level is too broad for useful results, while any level smaller than zip code proved to be too sparse. Machine learning models can rarely perform well when training on data that consists of mostly zeroes. Smaller geographical levels contain too few positive examples of incidents for any model to successfully learn the trends of each area. Additionally, the temporal level was chosen to be at the monthly scale, rather than yearly or weekly, due to early testing results suggesting the best performance at monthly levels.
Even at the county level, the dataset is still fairly sparse, which seems to negatively affect performance. For example, a transformer model was trained on the raw data and made predictions for each county for the final month of the data. We evaluated these models with SMAPE, which is an adjusted percentage error metric modified to be adequate for sparse datasets. This initial model, trained on county-month data, achieved a relatively poor SMAPE of 0.658. It was clear that other adjustments to the data were necessary.
First, the results of the transformer model were modified to treat the problem not as a forecasting one, but as a classification one. Rather than predicting a specific number of incidents that would occur in a given county in a given month, it instead simply predicted whether or not an incident would occur. The model achieved an F1 score of 0.861 on the county-month dataset, which was the highest of any geographic and time level combination. The results were good, but reformatting the problem as a binary classification task seemed to oversimplify it. Some counties were likely to always have 1’s, and others were likely to always have 0’s. Therefore, this solution seemed inadequate for identifying high risk areas.
The next adjustment to the problem was to change the model again so that, rather than predicting the number of incidents by county, it predicted the rank of each county, if they were ordered by the number of incidents to occur. The county with the most incidents in a given month would be ranked first, and any counties with no incidents that month would be ranked last. Here, the transformer model significantly improved, achieving a much lower SMAPE of 0.282. However, these rankings rarely changed by much over time. By changing the rankings so they ordered by the number of incidents per capita rather than the raw number of incidents, the SMAPE was 0.429. These results are better than when predicting on the raw data, but more improvements are likely still necessary.
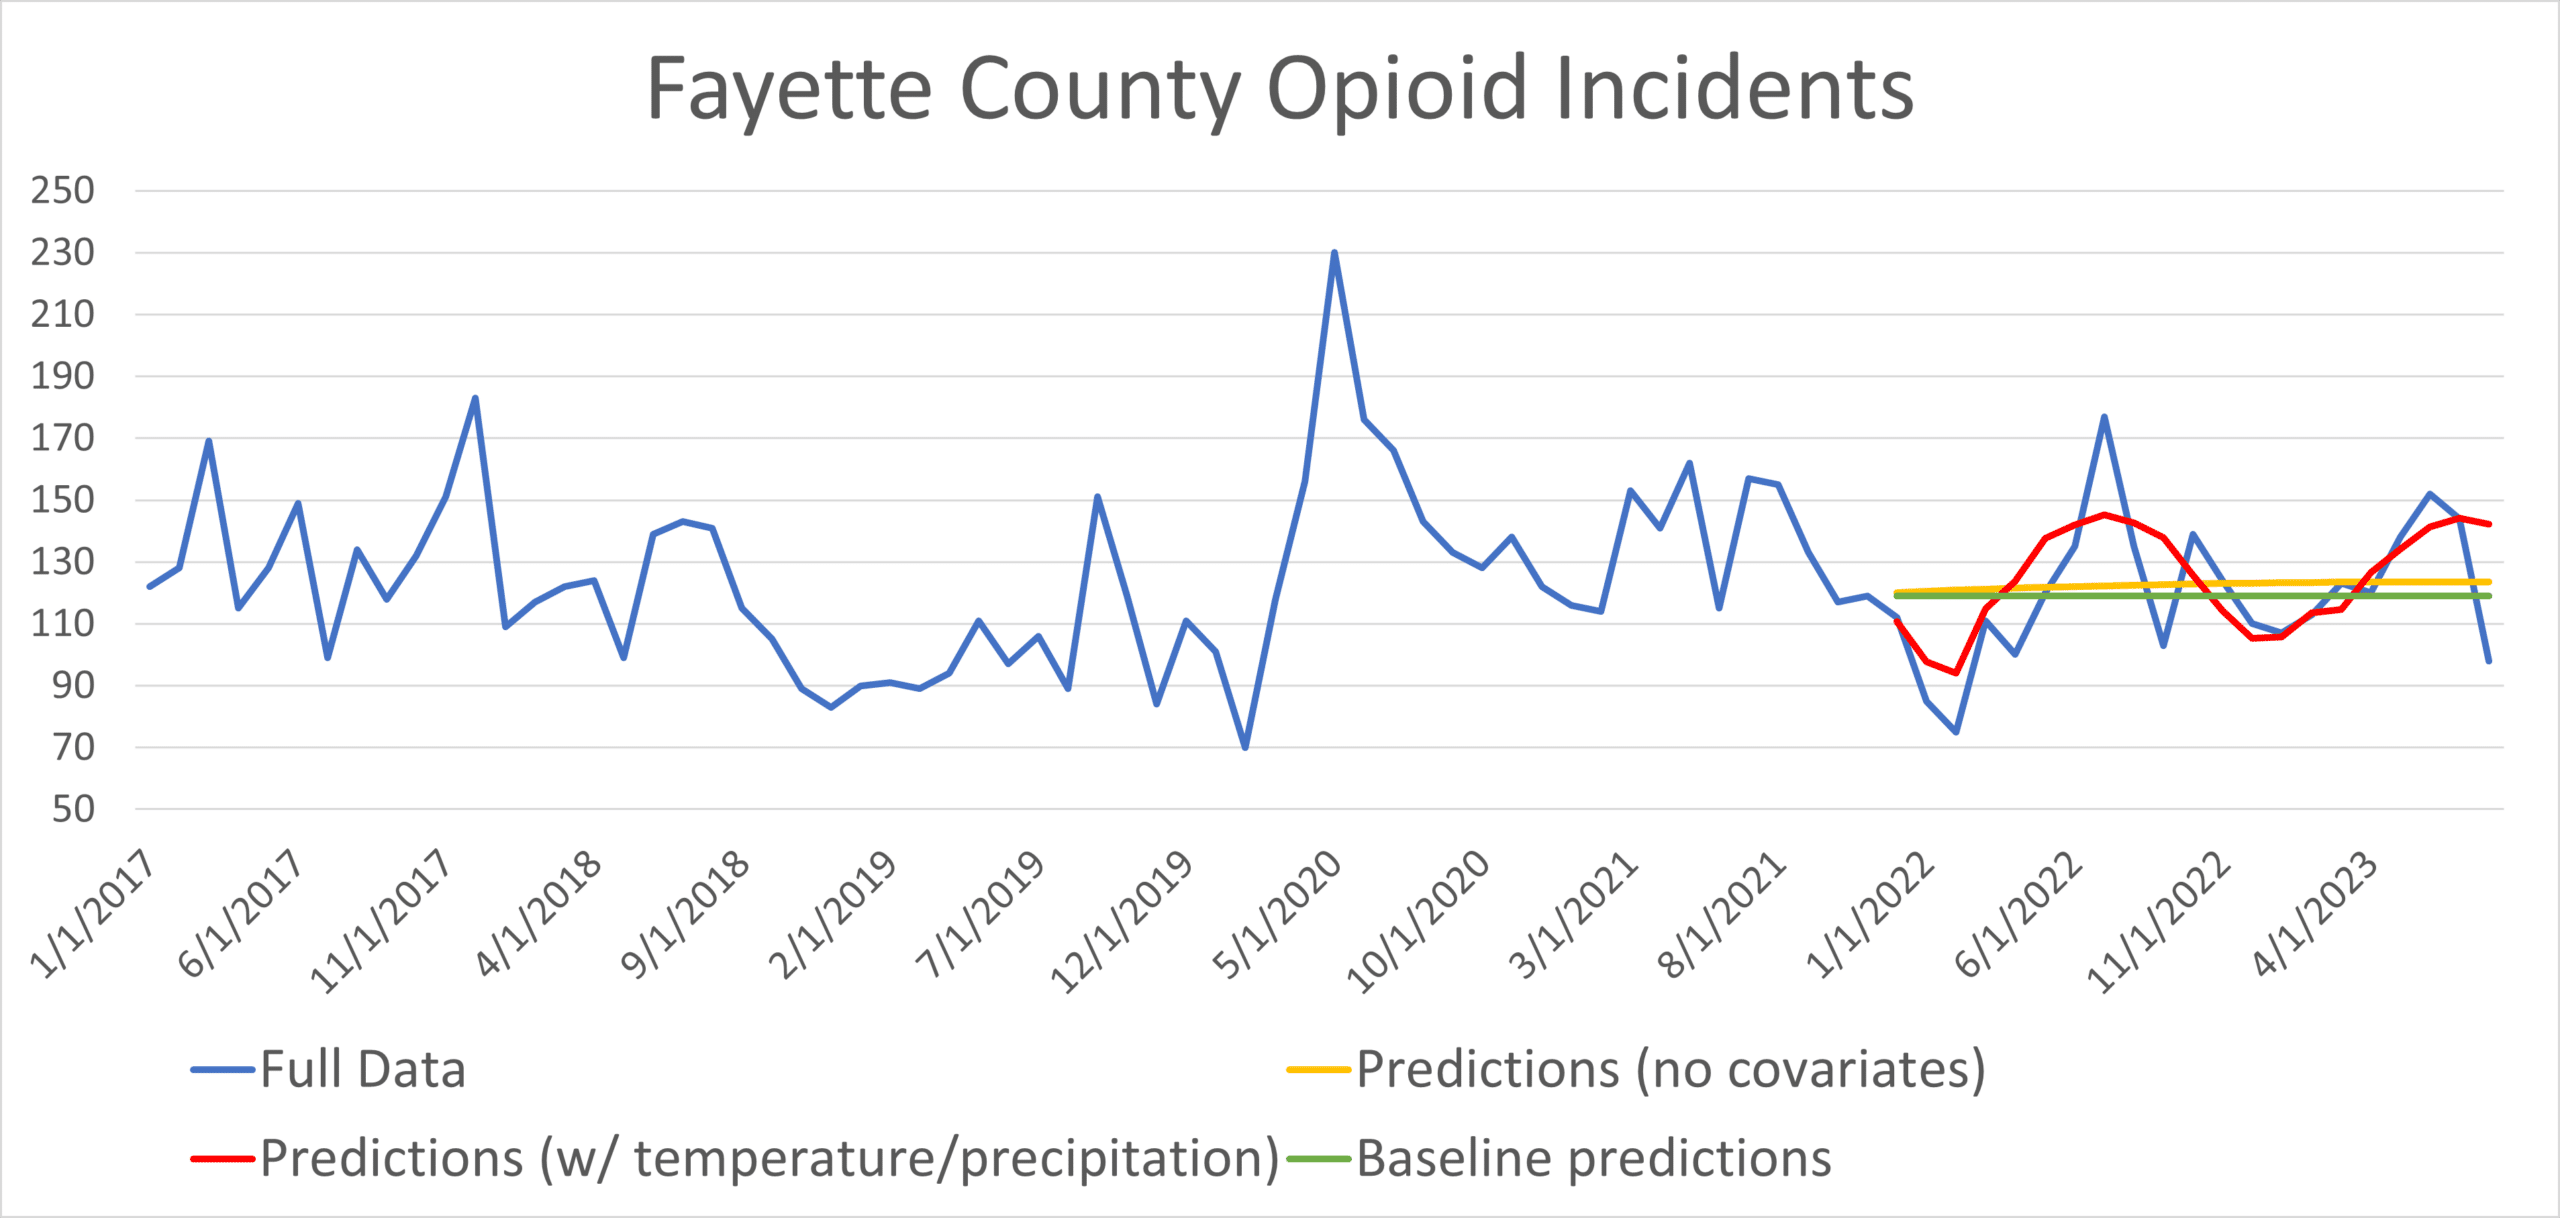
We believe this type of model can be improved with additional covariates, which are extra data that aid in predictions. To demonstrate this, we included average temperature and precipitation data for Fayette County. The model was trained to predict the number of incidents for each month, using this extra data to help. A comparison of the results is shown below.

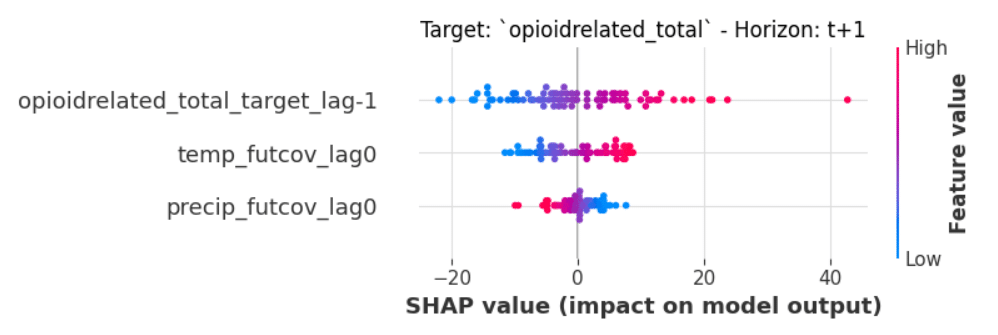
Without any covariates, the model’s predictions all remain very close to the mean, providing little improvement over a baseline model that explicitly only predicts the mean at each time step. However, by including temperature and precipitation with the model, the results are clearly improved. Analysis of the data has shown that the number of incidents tends to increase in the summer, and this is shown in the predicted increase in incidents during the warmer months. Additionally, the importance of each covariate to the model can be directly evaluated using SHAP scores, which provide values that represent how much each feature impacts the model’s predictions. A visualization of these SHAP scores is shown below.

The highest feature, written as “opioidrelated_total_target_lag-1” simply represents the number of incidents that occurred in that county during the previous month. Unsurprisingly, this feature is listed first as the most important, and the graph shows that higher values of this feature are correlated with higher prediction values. Temperature is next, and there is a similar positive relationship, proving the relationship demonstrated earlier. Precipitation is lowest, suggesting that it has the least impact on the model’s predictions, and the colors are flipped, which means lower precipitation values are correlated with more incidents. This kind of analysis can provide a great deal of information about the issue and how counties may be identified as high-risk in the future. There are many more covariates that could prove to be more useful to the model than simply temperature and precipitation. However, these results demonstrate that covariates are very likely to improve performance in any case.
There is still much work to do for this analysis. Most importantly, more covariates will be tested and analyzed. One such covariate is the number of police seizures of opioids in each county. By itself, this data has not proven to significantly improve results. However, by including data on what kinds of drugs have been seized, we hope that a correlation between the number of incidents and opioid seizures can be determined and utilized to improve the model. Additionally, we plan to evaluate a “hotspot” system that utilizes more geographical data. This approach would include data that describes the relative locations of each area so that the impact of increases in activity in a certain area can be evaluated on neighboring areas. This system would be able to identify which groupings of locations are increasing or decreasing in the number of incidents, allowing for a better picture of what areas are at higher risk than others.
